Depot CI metrics
View job metrics
From the Depot CI page, click a workflow run and select a specific job to view its metrics.
Sandbox resource utilization
The Resource Usage section above the logs displays CPU and memory utilization graphs for the job's sandbox. Use these graphs to determine if jobs are resource-constrained or over-provisioned.

Annotations on the graph mark the start of each step. Click an annotation to jump to the corresponding step in the log output.
Step-level timing
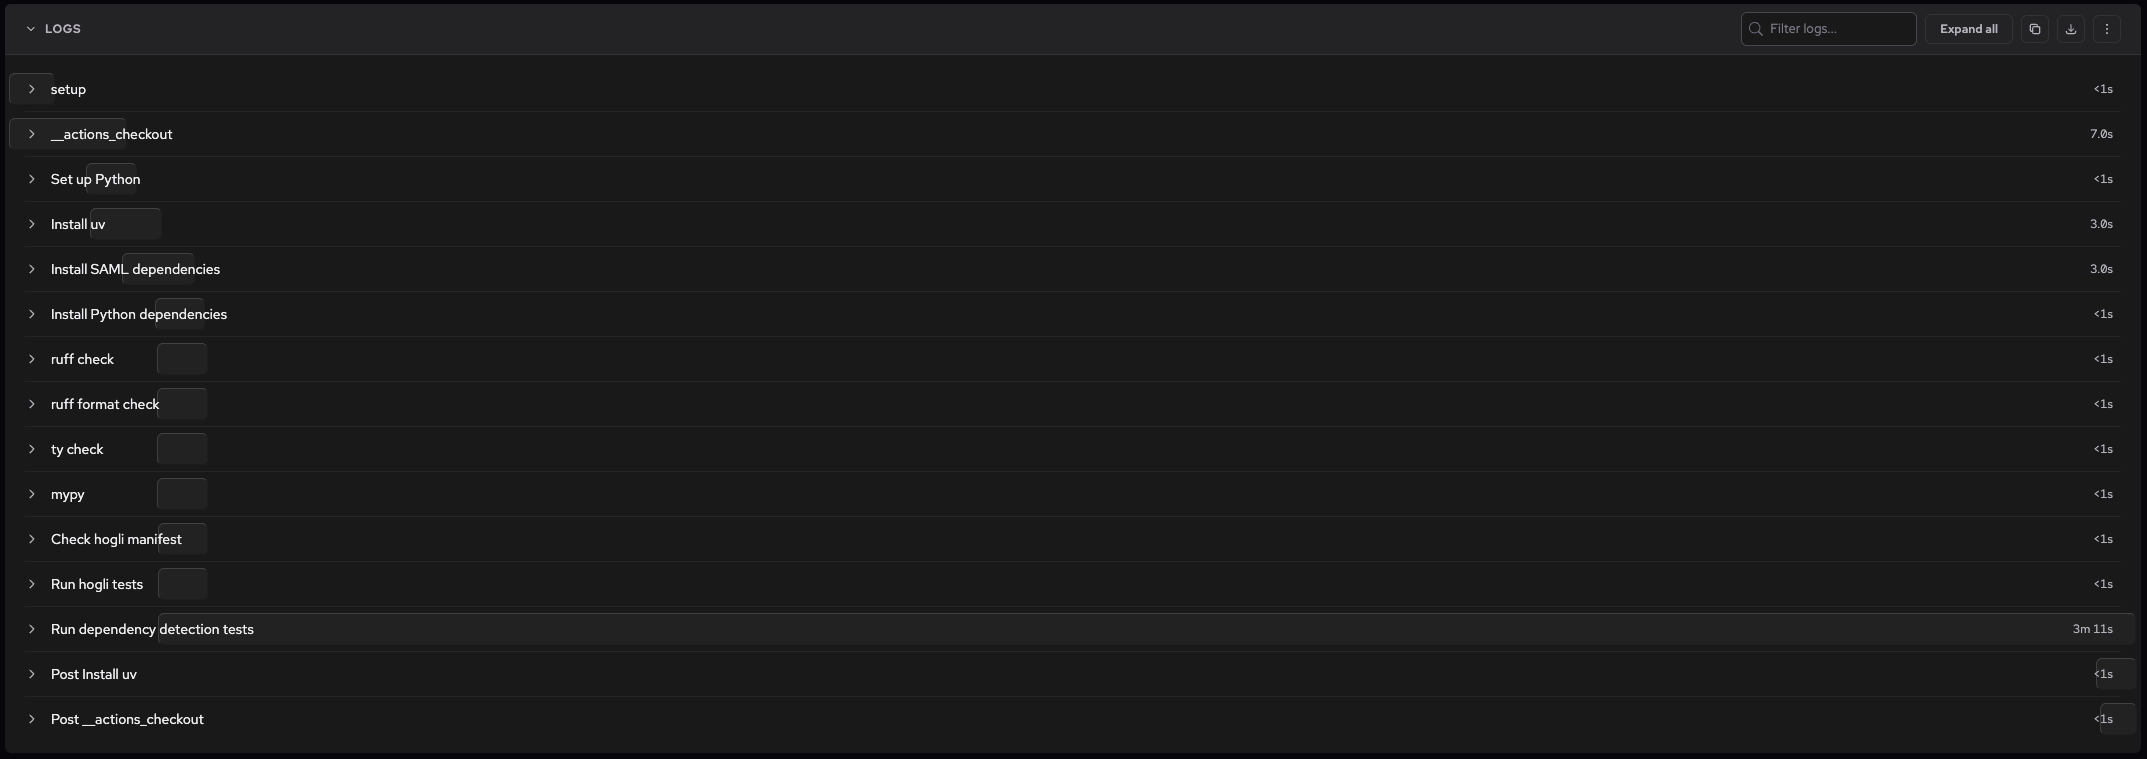
Each step in the job shows its name and duration. A visual timing bar indicates relative duration for longer-running steps, making it easy to spot bottlenecks like dependency installation or test execution.
AI failure diagnosis
When a job fails, Depot analyzes the failure and displays a Failure Diagnosis section at the top of the job detail view when a diagnosis is available. The diagnosis includes:
- What went wrong: An AI-generated explanation of the root cause based on the job's logs and error output.
- Suggested fix: Actionable steps to resolve the issue.

You can fetch the same diagnosis from the CLI with depot ci diagnose, pointed at a run, workflow, job, or attempt:
depot ci diagnose --run <run-id>The command groups similar failures across attempts, shows the diagnosis and possible fix for each group, and prints ready-to-run commands for drilling into a narrower target. For usage, see the depot ci diagnose docs or run depot ci diagnose --help.
For deeper investigation, you can debug a failing job with SSH to connect directly to the sandbox environment. For viewing and navigating job logs, see Depot CI logs.
You can also fetch job and run metrics programmatically with the Depot CI API.