Depot observability overview
Metrics, logs, and analytics in the Depot dashboard.
Organization-wide usage
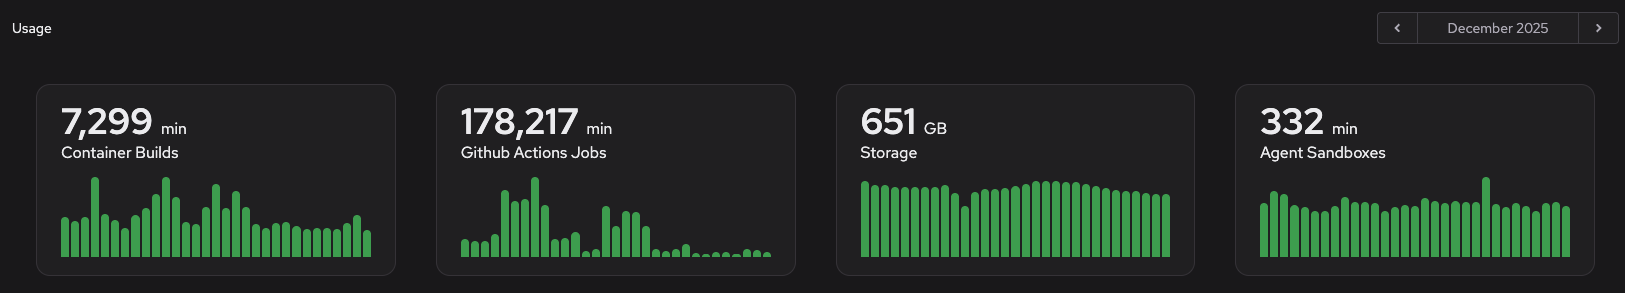
View your organization's monthly usage across all Depot services from the organization usage page.
At the top of the usage page, you can view a monthly summary of your organization's key metrics across products:
Exploring usage metrics
Filter data and interact with charts to explore metrics:
- View usage for a specific month. Click the month label to return to the current month.
- Click on chart bars to filter related tables by specific days.
- Hover over charts to see tooltips with exact values.
- Filter tables using the search inputs to find specific projects, workflows, repositories, or runner types.
- Health bars show the success/failure rate of recent builds or jobs for each project/workflow.
Container build metrics by organization
The Container Builds section shows metrics for all container builds in your organization. For metrics and monitoring by project and build, see Container build metrics and Container build logs.
| Metric | Description |
|---|---|
| Summary stats | Total builds, total billable time, and total time saved |
| Monthly charts | Build counts and build duration over time |
| Build Minutes by Project | Billable minutes, build counts, and recent build health status for each project |
Click on a day in the charts to filter the project table to show data for only that specific day. Use the project filter to search for specific projects by name.
GitHub Actions metrics by organization
The GitHub Actions section shows summary metrics for all GitHub Actions jobs in your organization. For more analytics and monitoring, see GitHub Actions metrics and analytics and GitHub Actions logs.
| Metric | Description |
|---|---|
| Summary stats | Total jobs, total billable time, total time elapsed |
| Monthly charts | Job counts and job duration over time |
| Job Minutes by Workflow | Usage by workflow with recent job health status (sort by clicking column headers) |
| Job Minutes by Repository | Usage by repository |
| Job Minutes by Runner Type | Usage by runner type |
Click on a day in the charts to filter all tables to show data for only that specific day. Use the filters to search for specific workflows, repositories, or runner types.
Test results analytics by organization
Test results are in beta and free to use during the beta period. If you have suggestions to make this feature better, reach out and let us know.
The Test Results Analytics page analyzes test results uploaded from your Depot CI jobs and GitHub Actions jobs, so you can see test health across the whole organization in one place. Results come from JUnit XML reports uploaded by the depot/test-report-action action. For job-level setup, see Depot CI test results and GitHub Actions test results.
The dashboard summarizes the selected timeframe and breaks results down by source (Depot CI vs GitHub Actions), repository, branch, and test suite. Use the filter controls at the top of the page to narrow by timeframe, source (Depot CI or GitHub Actions), repository, branch, test suite, file, or class. Use linked failure cards and recent event rows to drill in to the originating run.
| Metric | Description |
|---|---|
| Overview | Total results, failure rate, error rate, P95 duration, and a Depot CI vs GitHub Actions split |
| Tests over time | Test count by status (passed, failed, errored, skipped) over the selected timeframe |
| Failure rate over time | Failure rate trend across the selected timeframe |
| Test duration distribution | Test counts bucketed by duration so you can see where time is being spent |
| Test duration trends | Per-suite P95 duration trend lines to spot slowdowns |
| Failure rates by suite | Suites ranked by failure rate so you can find the noisiest areas |
| Most frequent test failures | Tests ranked by failure count across the selected timeframe |
| New failures | Tests that started failing in the selected timeframe |
| Possibly flaky tests | Depot CI tests that had a failure on one attempt and then passed on a later attempt for the same SHA |
| Top 5 slowest tests | Individual tests ranked by P95 duration |
| Recent events | A reverse-chronological feed of failing test events with links back to the originating CI or GitHub job |
Storage
The Storage section shows storage usage across all Depot storage types:
| Metric | Description |
|---|---|
| Container Layer Cache | Storage used by container image layers with daily trend chart |
| Actions Cache | Storage used by GitHub Actions cache with daily trend chart |
| Ephemeral Registry | Storage used by the ephemeral registry with daily trend chart |
| Remote Build Cache | Storage used by remote build cache with daily trend chart |
| Storage by Project | Storage breakdown by project |
Click on a day in the charts to see storage usage for that specific day.
Agent sandboxes
The Agent Sandboxes section shows usage metrics for Depot agent sandboxes:
| Metric | Description |
|---|---|
| Summary stats | Total agent sandboxes, total billable time, total elapsed time |
| Monthly charts | Sandbox usage over time |