Depot CI logs
Find a workflow run
Go to the Depot CI page to see workflow runs across your repositories. The sidebar lists runs with their workflow name, repository, status, and relative timestamp. Click a workflow run to open its details.
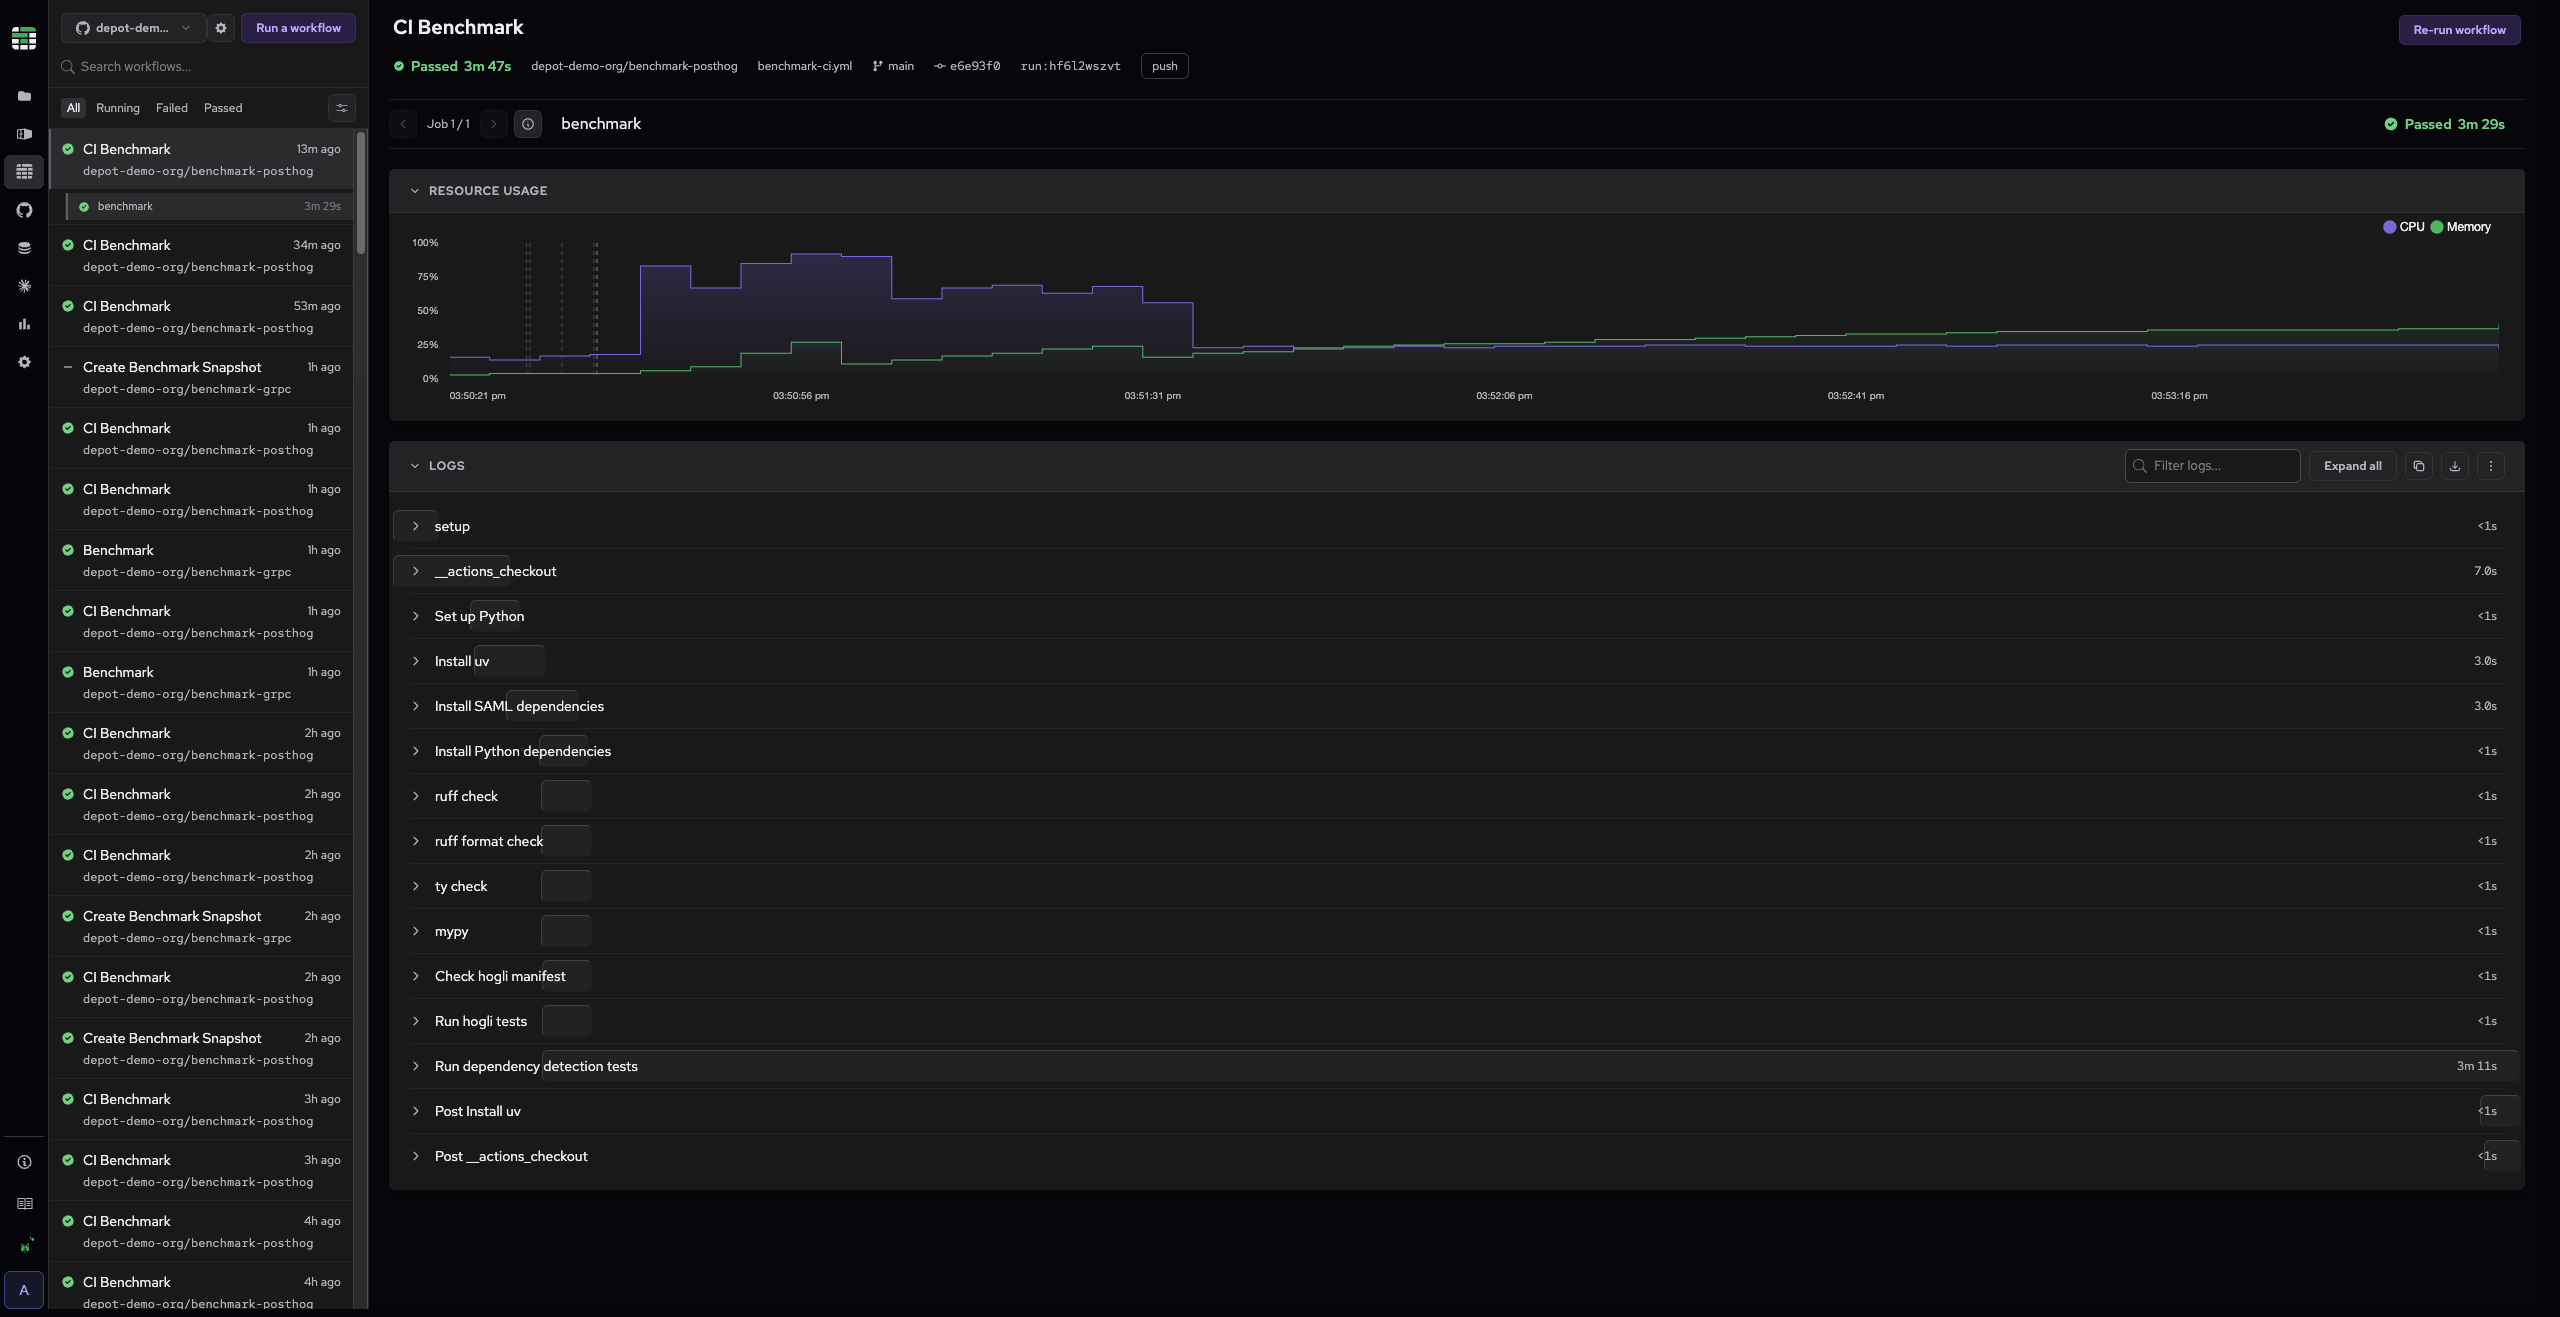
Use these controls to find the run you need:
- Search: Type in the search box at the top to filter workflows by name.
- Status tabs: Click All, Running, Failed, or Passed to filter by run status. You can also filter by repository, trigger, SHA, run ID, PR number or workflow ID.
From the command line, you can use depot ci run list to list recent queued and running runs, and depot ci status to view the status of a specific run.
View logs for a job
Select a job to load its logs. The log viewer displays the full output organized by step. Each step shows its name on the left and duration on the right. A visual timing bar indicates relative duration for longer-running steps.
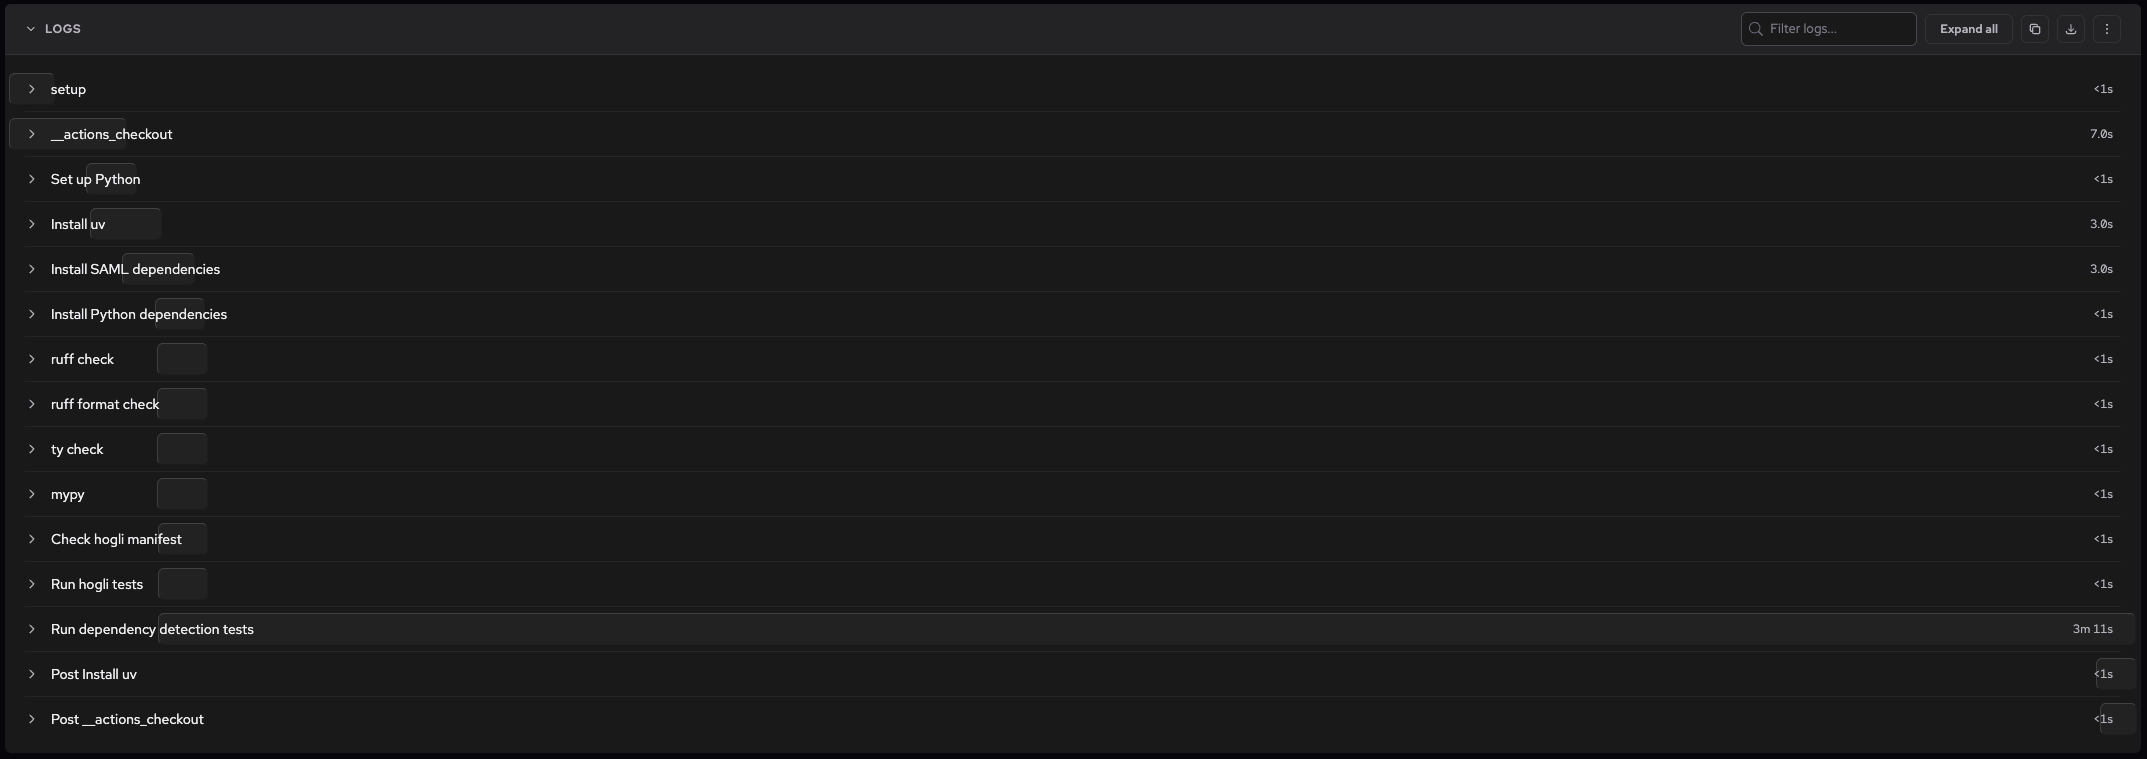
Click a step name to collapse or expand its log output. Use Expand all in the toolbar to open all steps at once. Use the filter box to search logs by keyword, and the download or copy buttons to export the log output.
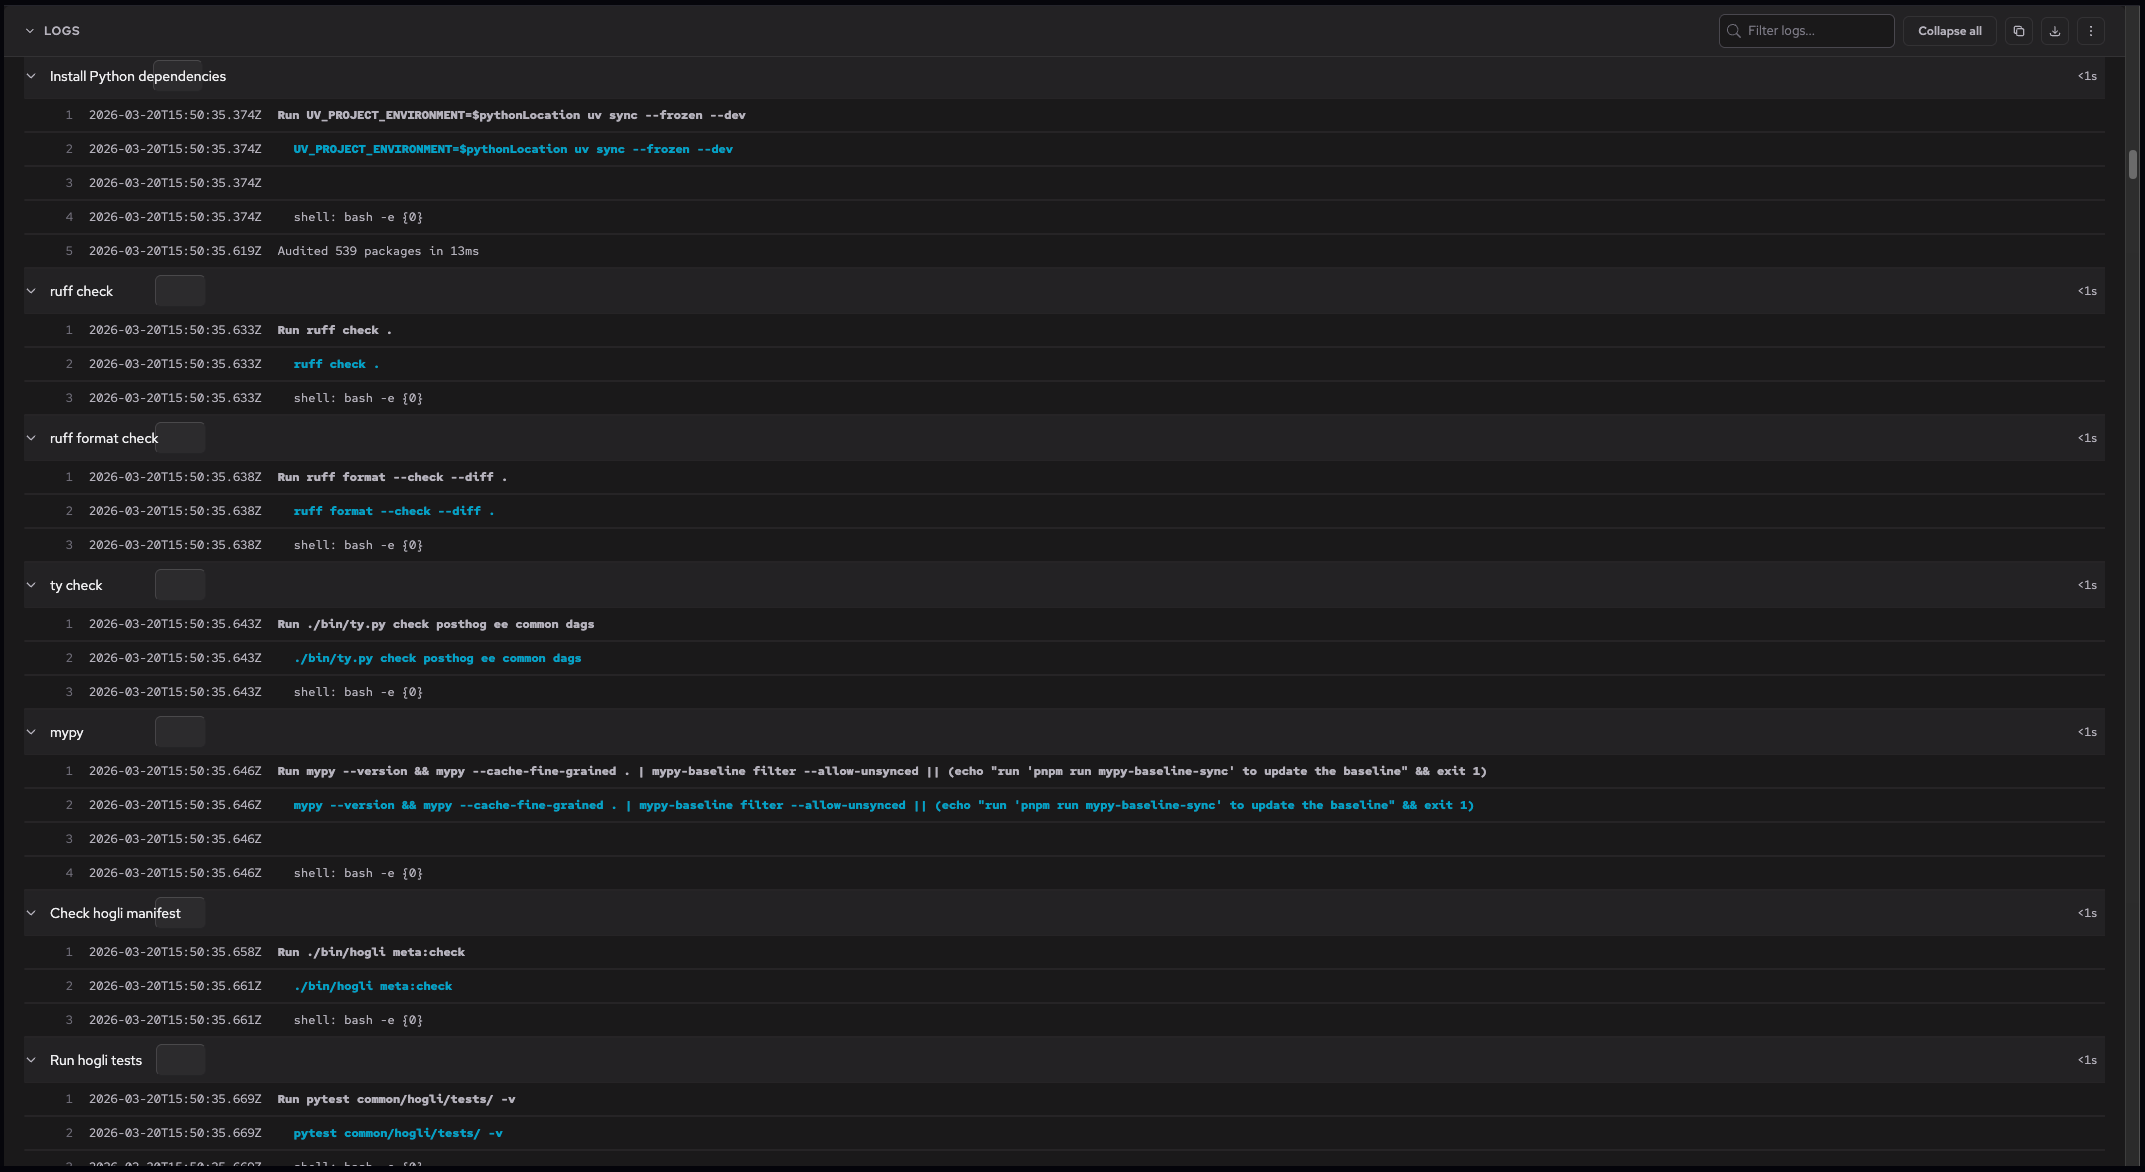
You can also fetch logs from the command line with depot ci logs, which prints a job attempt's log output to stdout. Add --follow (or -f) to stream a running job's logs as they're produced, or pass --follow to depot ci run to start a run and follow its logs in one command. To read logs programmatically, use the Depot CI API.
Link to a job from within a workflow
Every Depot CI job sets a DEPOT_JOB_URL environment variable containing a direct link to that job attempt's page in the Depot dashboard. Use it to surface the run from any step, such as a Slack message, a GitHub comment, or a custom webhook notification. For example:
- name: Notify Slack
  run: |
    curl -X POST $SLACK_WEBHOOK \
      -H 'Content-type: application/json' \
-d "{\"text\": \"Build finished: $DEPOT_JOB_URL\"}"For the list of variables Depot CI sets in every job, see the environment variables reference.